Share market live chart today
Share market live chart today Sensex & Nifty: Your Friendly Guide to India’s Stock Market Giants
Ever heard someone talk about the Sensex or Nifty and felt a bit lost? Don’t worry, you’re not alone! These are the two major indices that represent the health of the Indian stock market, and understanding them can be easier than you think.
What are Sensex and Nifty?
Think of them as scoreboards for the Indian stock market. They track the performance of a select group of companies, giving you a snapshot of how the market is doing overall.
Sensex (S&P BSE Sensex):
This is the older of the two, created by the Bombay Stock Exchange (BSE).
It tracks the performance of 30 of the largest and most actively traded companies on the BSE.
Nifty 50 (National Stock Exchange Fifty):
This index is maintained by the National Stock Exchange (NSE).
It tracks the performance of 50 of the largest and most liquid companies on the NSE.
Why are they important?
Market Barometer: They act as a general indicator of the market’s direction. If the Sensex or Nifty is rising, it generally means the market is doing well, and vice versa.
Investment Benchmarks: Many mutual funds and investment portfolios use these indices as benchmarks to measure their performance.
Economic Indicators: They can reflect the overall health of the Indian economy.
How do they work?
Both indices are calculated based on the market capitalization of the companies they track.
Changes in the stock prices of these companies affect the index values.
What affects Sensex and Nifty?
Many factors can influence these indices, including:
Economic Growth: Strong economic growth usually leads to a rising stock market.
Company Earnings: Good earnings reports from major companies can boost investor confidence.
Government Policies: Changes in government policies can impact specific industries and the overall market.
Global Events: International events, such as economic crises or political instability, can also affect the Indian stock market.
Investor Sentiment: How investors feel about the market can also cause fluctuations.
How to follow them:
You can easily track the Sensex and Nifty on financial news websites, apps, and brokerage platforms.
Most platforms provide live updates and historical data.
Key Takeaways:
Sensex and Nifty are essential tools for understanding the Indian stock market.
Understanding these indices can help you make more informed investment decisions.
2. Share market live chart today
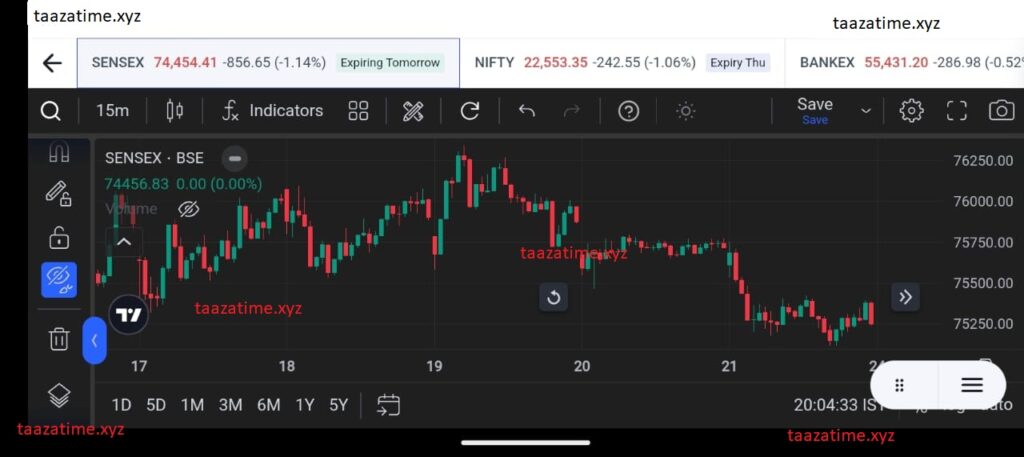
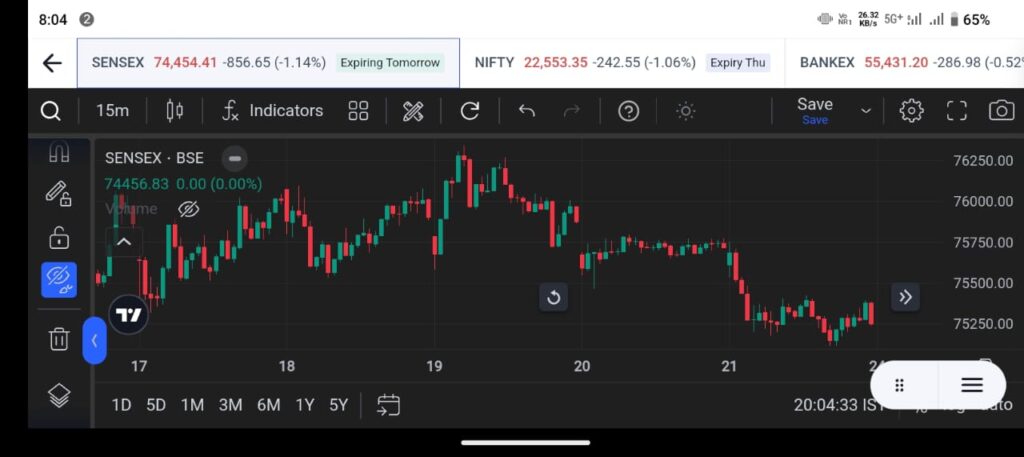
Decoding the Dance: Understanding Today’s Live Share Market Charts
The share market, with its constant fluctuations, can feel like a complex dance. But with live charts, you can get a real-time glimpse into the rhythm of the market and make informed decisions. Let’s break down how to understand these charts and what they tell you.
What Are Live Share Market Charts?
Think of live charts as a visual representation of how a stock’s price is changing in real-time. They provide a dynamic view of market activity, allowing you to see:
Price Movements: How a stock’s price is fluctuating throughout the trading day.
Volume: How many shares are being traded at any given moment.
Trends: Whether a stock’s price is generally rising, falling, or moving sideways.
Why Are Live Charts Important?
Real-Time Insights: They provide up-to-the-minute data, allowing you to react quickly to market changes.
Identifying Trends: They help you spot patterns and trends that can inform your trading decisions.
Making Informed Decisions: They give you the information you need to make more strategic buying and selling choices.
Key Elements of a Live Chart:
Candlestick Charts: These are the most common type of chart. Each “candlestick” represents a specific time period (e.g., 1 minute, 5 minutes, 1 day) and shows:
Open Price: The price at which the stock started trading during that period.
Close Price: The price at which the stock finished trading during that period.
High Price: The highest price the stock reached during that period.
Low Price: The lowest price the stock reached during that period.
Volume Bars: These bars at the bottom of the chart show the number of shares traded during each period.